Determination of Aflatoxins B₁, B₂, G₁, G₂ in Food and Grain Products
- Analyte: Aflatoxins B₁, B₂, G₁, G₂
- System: Agress 1100 or iChrom 5100 HPLC System with fluorescence detector and post-column photochemical derivatizer
- Column: SinoChrom ODS-BP (5 μm, 4.6 × 200 mm)
- Highlight: Enhanced sensitivity for B₁ and G₁ using photochemical post-column derivatization without additional reagents.
Introduction
Aflatoxins are toxic metabolites produced by aspergillus flavus and Aspergillus parasiticus growing on food and feed. They are highly toxic and carcinogenic, with aflatoxin B₁ being the most potent. Contamination can occur in grains, nuts, and their derived products, especially under warm and humid conditions. Detection typically requires derivatization to enhance fluorescence. Traditional pre-column trifluoroacetic acid (TFA) or post-column iodine derivatization methods are complex and involve hazardous reagents. Photochemical derivatization offers a simpler, safer, and more environmentally friendly alternative. This solution, based on GB/T 5009.23-2006, provides a complete workflow for the analysis of aflatoxins B₁, B₂, G₁, G₂ in grain products using HPLC with post-column photochemical derivatization.
Standards and Reagents
Aflatoxin standards: aflatoxins B₁, B₂, G₁, G₂ (purity appropriate for quantitative analysis); Methanol, HPLC grade; acetonitrile, HPLC grade; water, deionized (18.2 MΩ·cm);
Other materials: immunoaffinity columns or solid-phase extraction cartridges (for sample cleanup, as per standard methods), glass fiber filter paper, centrifuge tubes, volumetric flasks, pipettes, etc.
Standard Solution Preparation
Stock Solutions: Prepare individual stock solutions of aflatoxins B₁, B₂, G₁, G₂ in methanol at known concentrations (e.g., 1–10 μg/mL). Store protected from light at low temperature (≤4°C).
Mixed Working Solutions: Dilute appropriate volumes of stock solutions with mobile phase to prepare mixed standard working solutions at desired concentrations. For linearity studies, typical concentration ranges: B₁ and G₁ from 0.2 to 20.0 μg/L; B₂ and G₂ from 0.06 to 6.0 μg/L.
Sample Pretreatment
The general steps of sample preparation include:
- Extraction: Weigh a representative portion of the ground sample (e.g., corn, grain) and extract with methanol-water solution.
- Cleanup: Pass the extract through an immunoaffinity column or solid-phase extraction cartridge specific for aflatoxins. Wash to remove impurities.
- Elution: Elute aflatoxins with methanol or acetonitrile.
- Concentration (if needed): Evaporate the eluate under a gentle stream of nitrogen and reconstitute in mobile phase to a known volume.
- Filtration: Filter through a 0.45 μm membrane before HPLC injection.
Instruments and Equipment
System Configuration Options (Table 1):
Table 1. System Configuration Options
| Component |
Agress 1100 System |
iChrom 5100 System |
| Pump |
P1100 High-Pressure Pump |
P5102 High-Pressure Pump |
| Detector |
D1100 UV-Vis Detector (optional) + Fluorescence Detector |
D5101 UV-Vis Detector (optional) + Fluorescence Detector |
| Injector |
Rheodyne 7725i Manual Injector |
Rheodyne 7725i Manual Injector (or S5101 Autosampler optional) |
| Column Oven |
O1110 Column Oven |
O5100 Column Oven (optional) |
| Post-Column Derivatizer |
PD3110 Photochemical Derivatizer |
PD3110 Photochemical Derivatizer |
| Column |
SinoChrom ODS-BP (5 μm, 4.6×200 mm) |
SinoChrom ODS-BP (5 μm, 4.6×200 mm) |
| Data Station |
Chromatography Data Station |
Chromatography Data Station |
| Accessories |
VB1100 Valve Bracket, ST1100 Solvent Tray |
VB5101 Valve Bracket, M5102 System Organizer, AD Adapter, 5100 Tool Kit |
Chromatographic Conditions
- Column: SinoChrom ODS-BP (5 μm, 4.6 × 200 mm)
- Mobile Phase: Methanol / Acetonitrile / Water = 20 : 20 : 60 (V/V/V)
- Flow Rate: 0.8 mL/min
- Detection: Fluorescence detector, excitation wavelength 360 nm, emission wavelength 450 nm
- Post-Column Derivatization: Photochemical derivatizer (PD3110) installed between column and detector
- Injection Volume: 20 μL
- Column Temp.: Ambient
Experimental Results
Standard Separation
A typical chromatogram of a mixed aflatoxin standard solution (20.0 μg/L) after photochemical derivatization is shown in Figure 1. The derivatization significantly enhances the signals of B₁ and G₁ while having minimal effect on B₂ and G₂, as summarized in Table 2.
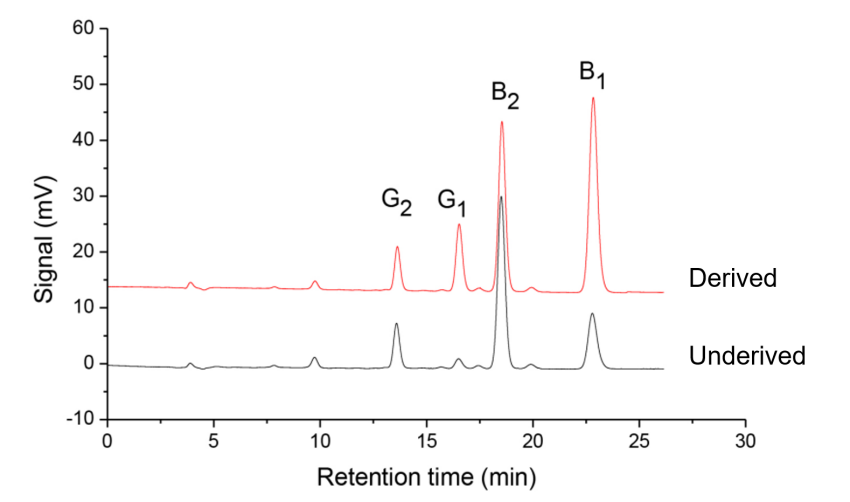
Fig.1. Chromatogram of mixed standard solution (20.0 μg/mL) of aflatoxin
Table 2. Comparison of response before and after derivatization
| Aflatoxin |
Before Derivatization |
After Derivatization |
| Peak Area (mV·s) |
Peak Height (mV) |
Noise (mV) |
Peak Area (mV·s) |
Peak Height (mV) |
Noise (mV) |
| G₂ |
160.22 |
7.98 |
0.025 |
149.77 |
7.82 |
0.025 |
| G₁ |
39.49 |
1.72 |
256.92 |
11.92 |
| B₂ |
752.59 |
30.79 |
711.06 |
30.43 |
| B₁ |
295.13 |
9.87 |
982.48 |
34.92 |
Linearity and Detection Limit
Calibration curves were constructed using mixed standard solutions at various concentrations. Linearity and detection limits are summarized in Tables 3.
Table 3. Linear Equations and Correlation Coefficients
| Aflatoxin |
Linear Equation |
Correlation Coefficient (R) |
Linear range |
MDL (μg/kg) |
| G₂ |
y = 22.185x - 0.3282 |
0.99990 |
0.06 – 6.0 μg/L |
0.03 |
| G₁ |
y = 23.547x + 1.0349 |
0.99987 |
0.2 – 20.0 μg/L |
0.08 |
| B₂ |
y = 33.410x + 1.6965 |
0.99984 |
0.06 – 6.0 μg/L |
0.01 |
| B₁ |
y = 41.875x + 3.3725 |
0.99994 |
0.2 – 20.0 μg/L |
0.03 |
Sample Analysis
A commercially purchased corn sample was analyzed following the described procedure. Results are shown in Table 4 and Figure 2.
Table 4. Aflatoxin Content in Corn Sample
| Aflatoxin |
Concentration in Extract (μg/L) |
Content in Sample (μg/kg) |
| G₂ |
Not detected |
Not detected |
| G₁ |
0.08 |
0.08 |
| B₂ |
Not detected |
Not detected |
| B₁ |
Not detected |
Not detected |
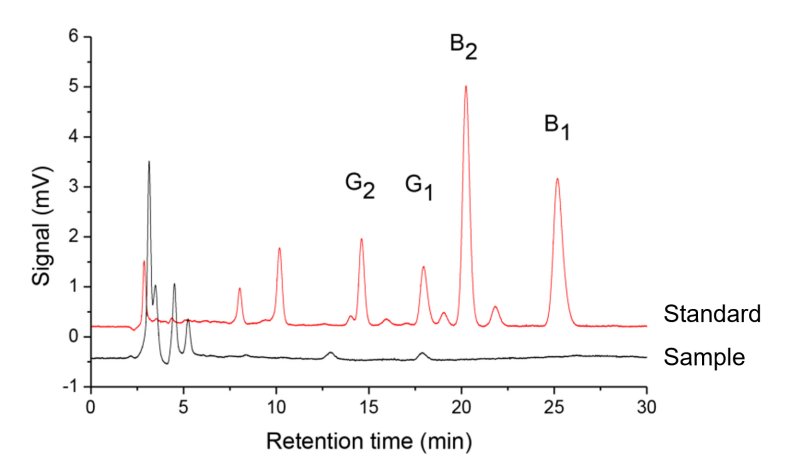
Fig.2. Chromatogram of mixed aflatoxin standard solution (20.0 μg/mL) and corn sample solution